I had the opportunity to attend the National Adaptation Forum in St. Paul in May, and it made a big impression on me. My life’s work, and much of our work at LHB, focuses on mitigation of GreenHouse Gas (GHG) emissions and reducing climate change. Over the years we have heard the terms “resiliency” and “adaptation” become very popular, but the definitions seem a bit elusive. I was recently referred to the Rockefeller site on Resiliency. Their definition, “Resiliency is the capacity of individuals, communities and systems to survive, adapt and grow in the face of stress, and shocks and even transform when conditions require it”, is the best I have seen. Resiliency appears to focus on the catastrophic events we now see happening with far more frequency. I saw slides of the Duluth floods in 2012 more than any other image at this national conference.

The focus of the Forum moved beyond mitigation to adaptation. I saw dozens of very smart (PhD level) people talk about changes that have occurred; how we are adapting, and can adapt in the future. One example is the fact that the dominant species of fish in Wisconsin lakes is shifting from walleye to bass due to the warmer water temperatures. Our changing climate is an inevitable fact, and the current research is focused on what it means, at what rate it might continue and how we can best adapt to it.
There were only one or two sessions that focused on building and site design. I came away with the sense that there is a very big vacuum on the application of adaptation within the architecture and engineering professions. There were some very smart folks there from HGA, Perkins and Will, and Arup that are operating in the cutting edge, trying to determine how we can revise weather files for energy modeling in a way that they will be more accurate. It appears the architecture and engineering professions are currently designing buildings that will be in very different climate zones during their expected lifetimes without planning for needed adaptation
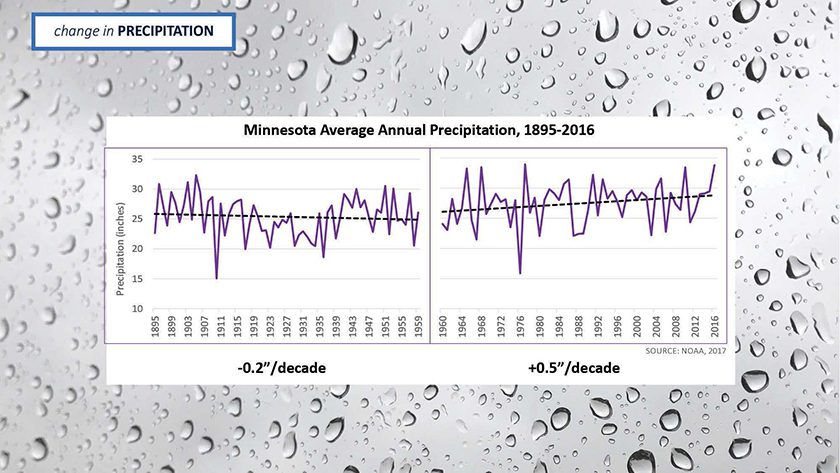
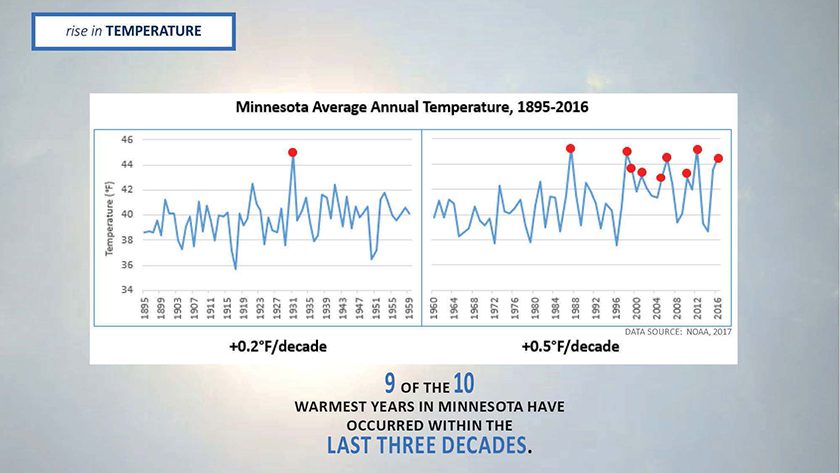
The two graphs below were the most profound. They each show the steady increase in precipitation (1/2 inch per decade) and temperature (2/3-degree F per decade) that we are experiencing in Minnesota. My goal would be for architects and engineers to make sure we are taking these two basic facts into consideration on every project we do. After attending the Forum, I motivated to begin a shift in focus from mitigation to adaptation and am inspired to begin actively working on this right away.
