
In 2007, Minnesota law established a goal to reduce greenhouse gas emissions from 2005 levels by at least 80% before 2050. To date, LHB’s projects have saved millions of tons of carbon and the firm continues to make contributions at every scale to help Minnesota meet its carbon emissions goal. Below are a few examples of projects that LHB has worked at various scales that are moving Minnesota to a clean and energy efficient future. To learn more about global carbon emissions, visit the EPA’s website.
BUILDING
In 1997, LHB designed the Phillips Eco-Enterprise Center for the Green Institute, currently known as the Greenway Office Building. It was a LEED Pilot project, won the American Institute of Architects Committee on the Environment Top Ten award and was one of LHB’s first projects to use Xcel Energy’s Energy Design Assistance program. The design of the 64,000 SF facility values occupant health, resource efficient construction, and energy efficiency strategies. The Energy Use Intensity (EUI) of the office building is about 25 (kBtu/sf/year) whereas an average building of its kind has an EUI value of about 80. The yearly savings are equal to the carbon emissions from 57 homes’ energy use in one year2. Since 1997, this building has saved over 11.6 thousand tons of carbon1.

CITY
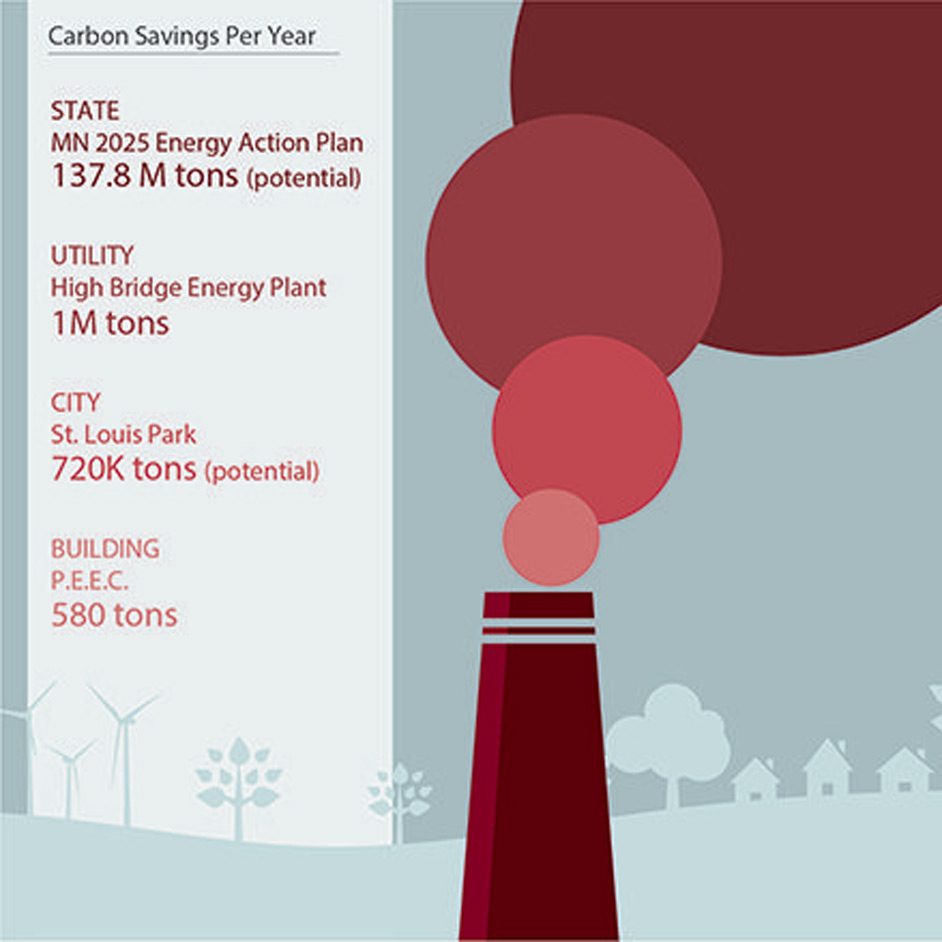
In 2017, the City of St. Louis Park, MN made a commitment to achieve carbon-neutrality by 2040. With the assistance of the Great Plains Institute and LHB (and using the Regional Indicators Initiative, created by LHB), the City is developing a Climate Action Plan to promote net-zero buildings, achieve carbon-neutral electricity by 2025, and advance strategies for thermal efficiency and decarbonization. To become carbon-neutral by 2040, and accounting for continued population and job growth, St. Louis Park will target reducing their emissions by around 30 thousand tons every year3. This yearly savings is equal to the carbon emitted from approximately 3 thousand homes’ energy use in one year2.
UTILITY
In 2007, LHB designed a pipeline for Xcel Energy to supply gas for the High Bridge Energy Plant in St. Paul, MN. Implementing this pipe allowed Xcel Energy to use natural gas versus coal to produce electricity, resulting in a savings of about 1 million tons of carbon per year. This yearly savings is equivalent to the carbon emitted from 108 thousand homes’ energy use in one year. Since 2007, the plant has reduced carbon emissions by 10 million tons.
STATE
The Minnesota Legislature passed the Next Generation Energy Act in 2007 which set the goal to significantly reduce the state’s greenhouse gas (GHG) emissions. In 2014, Minnesota’s GHG emissions were only 4% lower than emissions from 2005. The state is still aiming to see an 80% reduction in GHG emissions by 20504. This will require gradually reducing emissions so that by 2050 Minnesota’s collective emissions will be 137.8 million tons less than the 2007 baseline. That savings is equivalent of removing around 313 thousand homes’ yearly energy use emissions every year until 2050.
To help the state accomplish this goal, LHB contributed to the team that developed Minnesota’s 2025 Energy Action Plan to advance strategies and technologies used in Minnesota for clean and efficient energy. With LHB’s contributions in advanced local energy planning, building energy benchmarking, and enhanced energy data access, the 2025 Action Plan pushes buildings and communities toward the state’s 80% emission reduction goals.
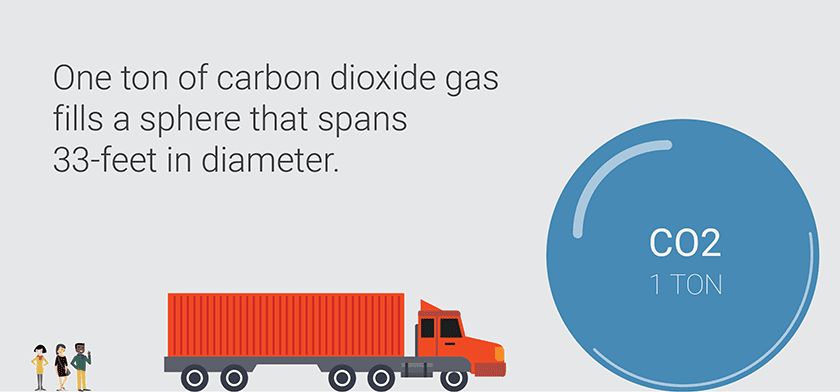
Hopefully this gives you a better idea of the way we measure carbon, how much we are doing at all scales at LHB and how far we must go.
What is your carbon footprint? To find out, visit https://www3.epa.gov/carbon-footprint-calculator/