Driving Minnesota Towards Sustainability Through Data
Many cities in Minnesota have taken steps to improve their sustainability, but what kind of an impact do their actions actually have? And, are these steps where they should be focusing their attention to achieve the most sustainable impact? Finding an answer to these questions led Rick Carter, a Senior Vice President of LHB, to conceive of the Regional Indicators Initiative (RII) in 2010.
RII began with the notion that a GreenStep City accomplishing 14 of 28 items on a checklist is only part of the process; understanding how we know we have “moved the needle” is critical. Many of the GreenStep criteria have a measurable impact on the amount of energy used, water consumed, vehicle miles traveled, and waste created. What was missing was that few cities have measured these indicators at the community-wide scale. RII involves measuring actual citywide outcomes to help cities make informed decisions based on solid data analysis.

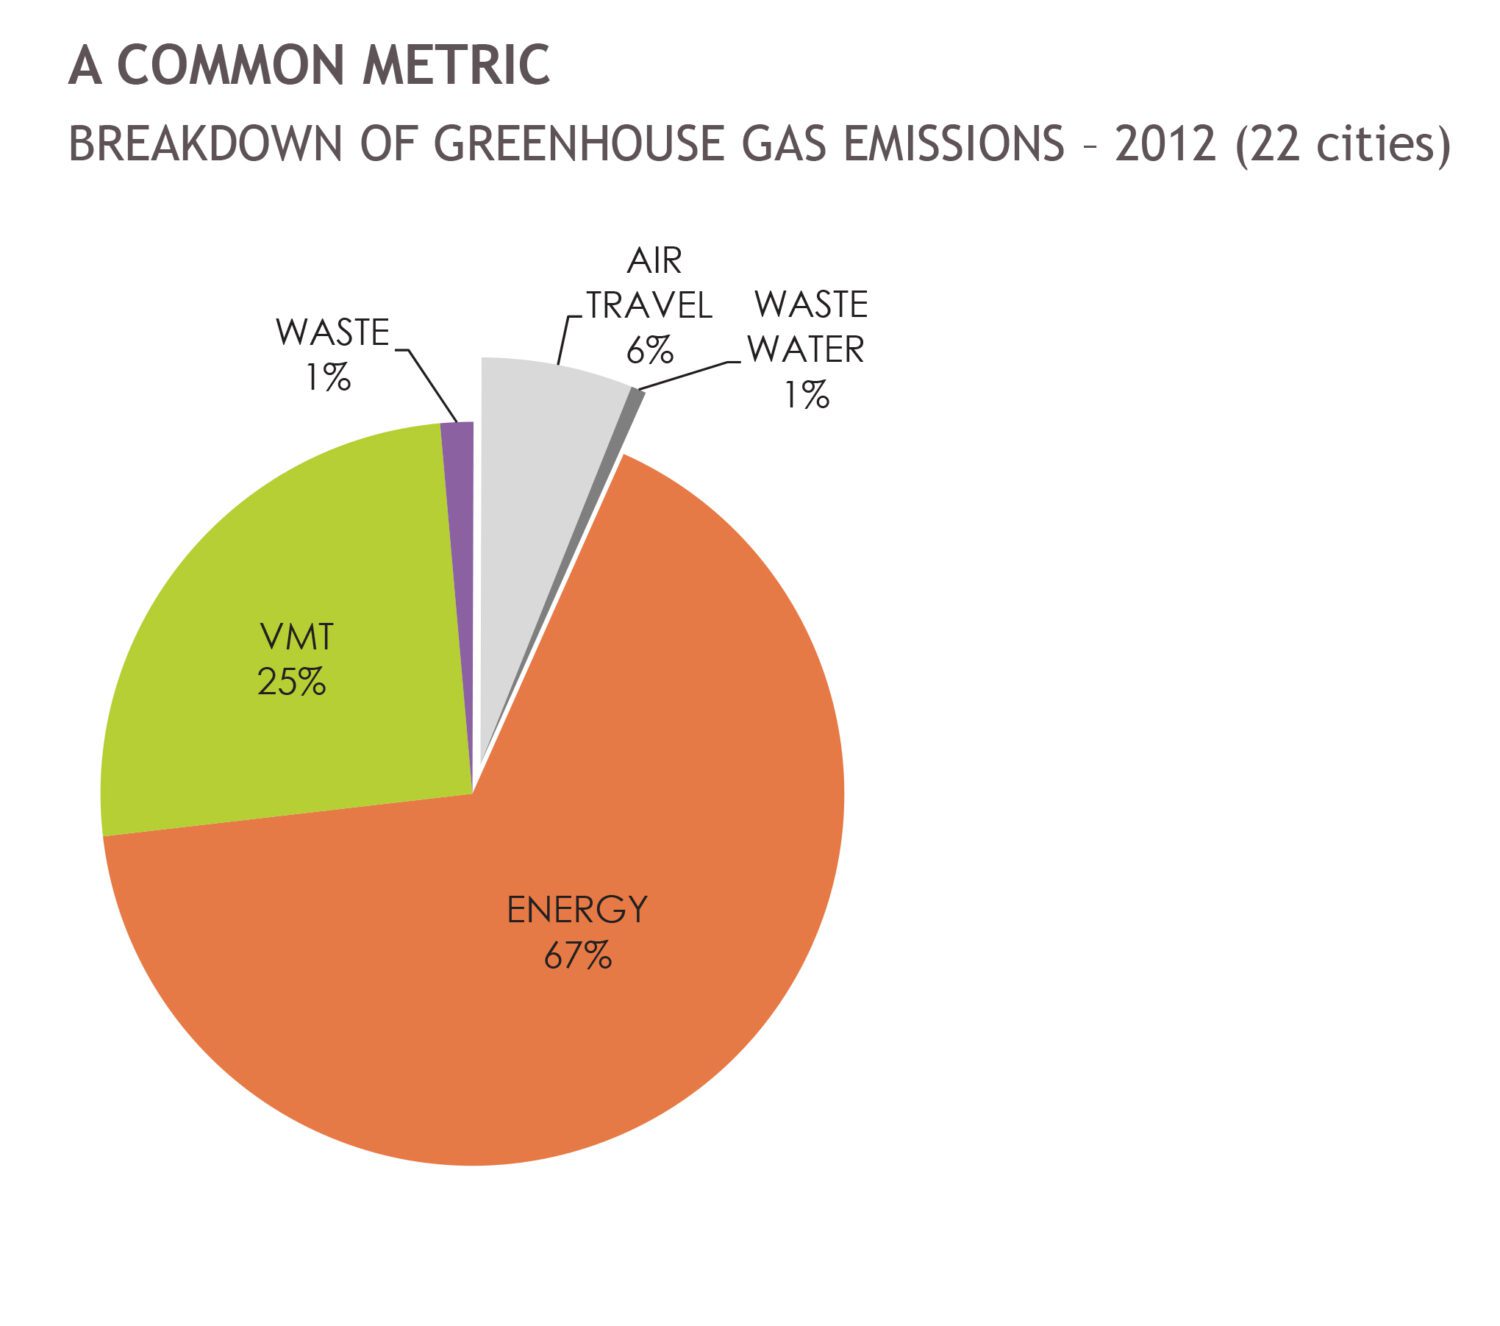
Each of the key RII indicators (Energy, Water, Waste, Travel) provide participating cities the opportunity to pinpoint actions that will have the greatest impact on their sustainable practices and the ability to track trends in the outcomes from these actions. As an example, the chart below represents the breakdown of GHG emissions across 22 RII cities. From it we can see the largest portion of their emissions is due to energy use. Thus, if cities target their efforts on programs emphasizing energy rather than water use reduction, they will have a larger impact on reducing their overall emissions.

RII provides data at the community scale, so that each city can look at its own pie chart and know where to focus its efforts. Cities can source ideas from GreenStep Cities as well as other resources and leverage shared data from the RII website to gain support for local sustainability programs. Evidence of benefits from these programs will support continued action and commitment to sustainability programs across the region.
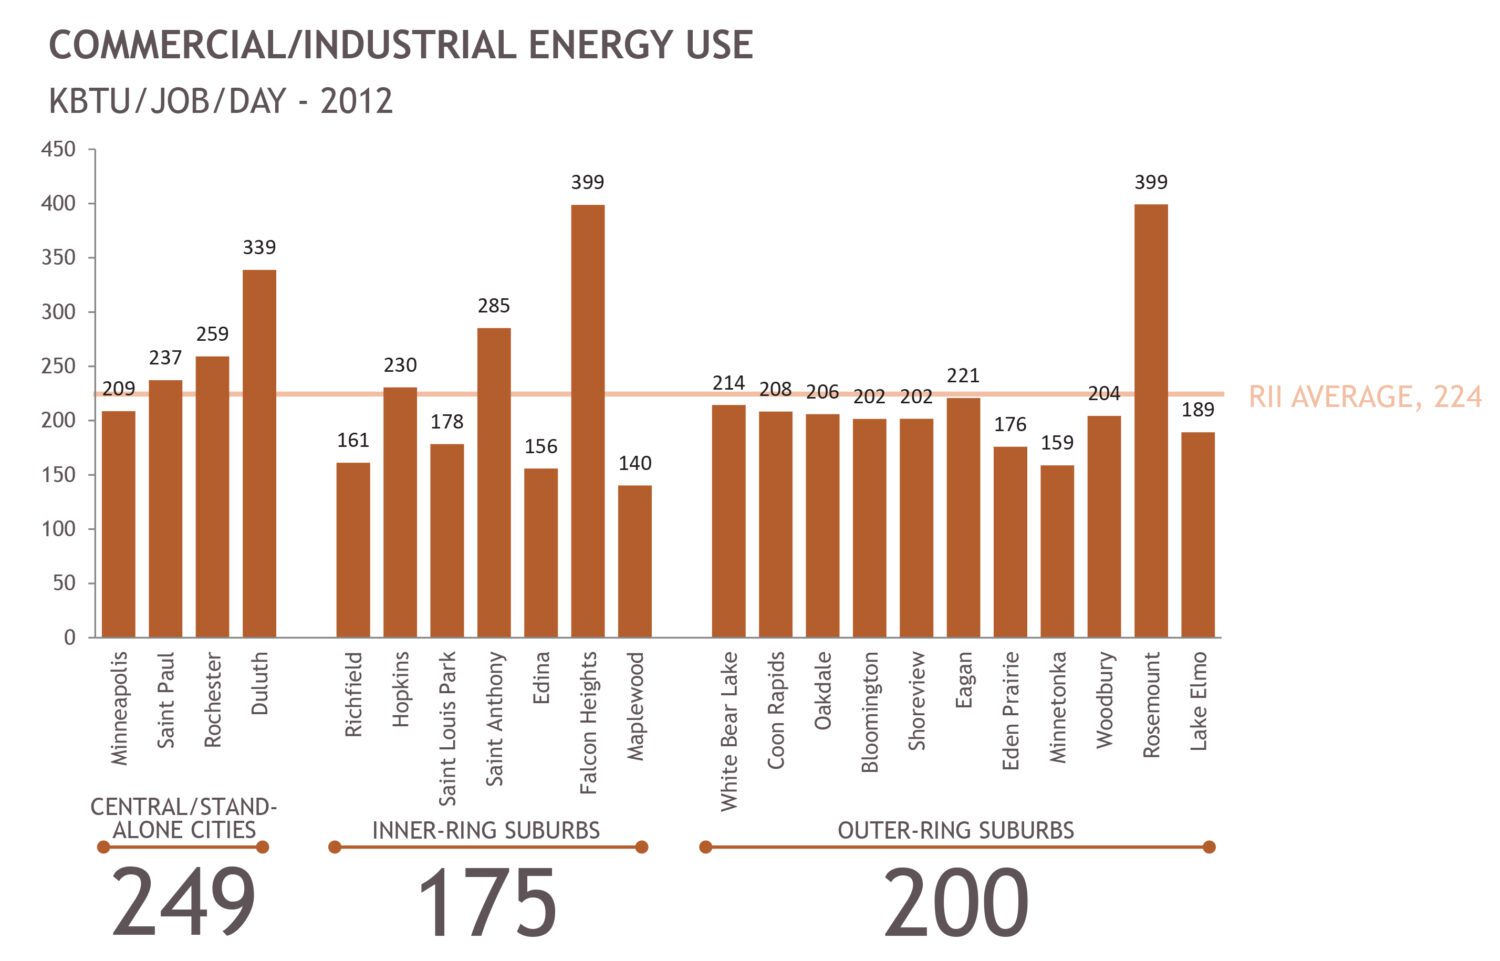
Below is an example zeroing in on energy consumption across RII cities in 2012. Using these results, cities are able to compare themselves to their peers and to help cities evaluate whether their usage is reasonably in line with others.

Six years after conception, Rick Carter continues to lead the RII team that also includes LHB’s Maureen Colburn, AIA, and Becky Alexander, AIA. Becky has provided support to the initiative through data collection, visualization, and website design. She says about RII, “The most challenging part is collecting robust and accurate data. Most utility companies lack experience tracking this type of data. We believe that through the Regional Indicators Initiative, many of them have come to recognize the importance of easily accessible data.”
RII provides a significant step toward informed policy creation in cities throughout Minnesota. The cross-sector collaboration by local governments, utility providers, private firms like LHB, and non-profit groups has demonstrated that enthusiasm can be created through a dialogue on RII data. The LHB team is currently expanding work on RII to more Minnesota cities through the U.S. Department of Energy-funded Minnesota Local Government Project for Energy Planning.
