
To meet the State of Minnesota’s target for greenhouse gas (GHG) emissions by 2050, we must come to terms with the fact that future solutions need to form through transformative, collaborative effort. The great news is that many innovative ideas have already been conceived, incorporated into law or voluntary programs such as GreenStep Cities, and carried out in the field. The question is, how do we know whether our efforts have made any real-world impacts?
What are our goals?
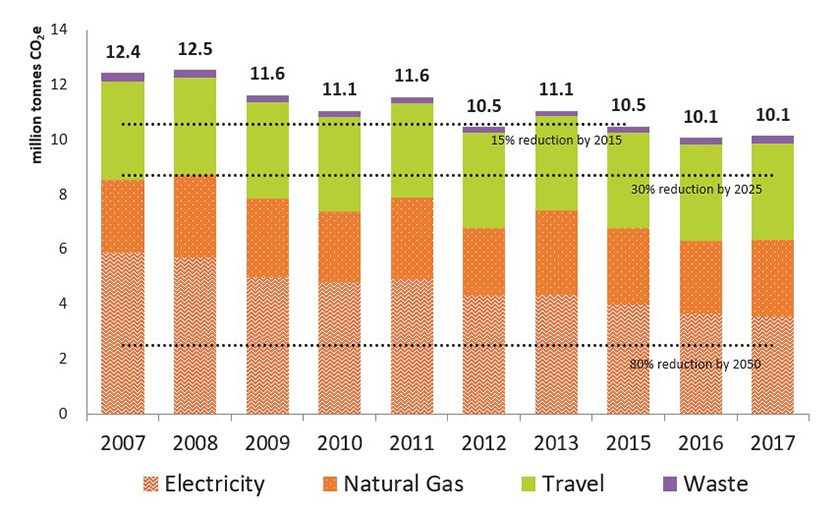
The first step towards creating a healthier, more responsible society is to address the issue of carbon emissions. Established in Minnesota’s Next Generation Act of 2007, our statewide emissions reduction goals are set at 15% reduction by 2015, 30% by 2025, and 80% by 2050, with the baseline set at 2005 emission levels.
While these are ambitious goals, it is imperative for our state’s health and financial well-being that we meet them. If we look at the data for the state of Minnesota, we can see that our target of 15% was missed in 2015 and we are not on track to meet our 2025 goal without additional effort.
How does RII track our goals?
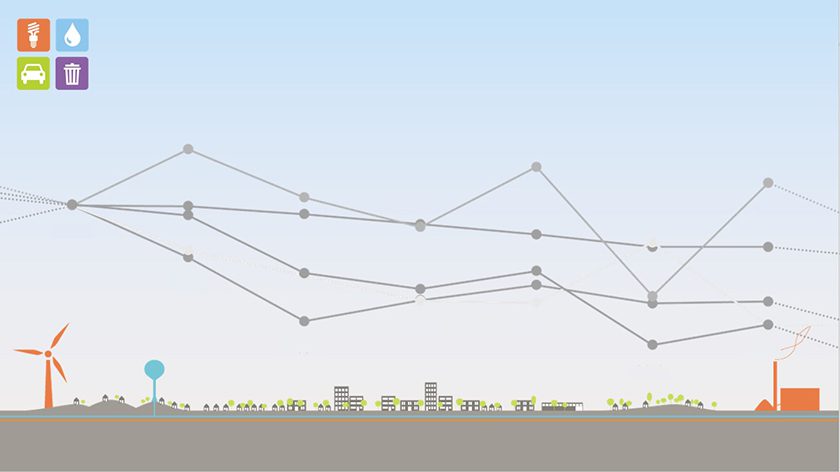
RII tracks the following metrics for 64 of Minnesota’s cities (44% of the State’s population) and translates them into greenhouse gas emissions:
Energy (BTU): Electricity, natural gas, and district energy consumed citywide (subdivided into residential and commercial/industrial)
Water (Gallon): Potable water consumed citywide (subdivided into residential and commercial/industrial)
Travel (Vehicle Miles Traveled): On-road distance traveled within city limits
Waste (Pounds): Citywide municipal solid waste managed via recycling, composting, combustion, and landfilling (prorated from countywide data)
Focusing on these four indicators allows us to understand greenhouse gas emissions and costs in less abstract terms.
How are we doing?
The good news is that in the cities we have 10 years of complete data for, we’ve seen a 19% decrease in overall emissions since 2007, meeting the State’s Next Generation Act goal of a 15% reduction from 2005 levels by 2015 and putting us on track to meet the 30% reduction goals by 2025.
However, these inventories are excluding a major portion of the state’s emissions – agriculture, which typically occurs outside city boundaries. This accounts for the discrepancy between reductions in city-wide emissions and state-wide emissions.
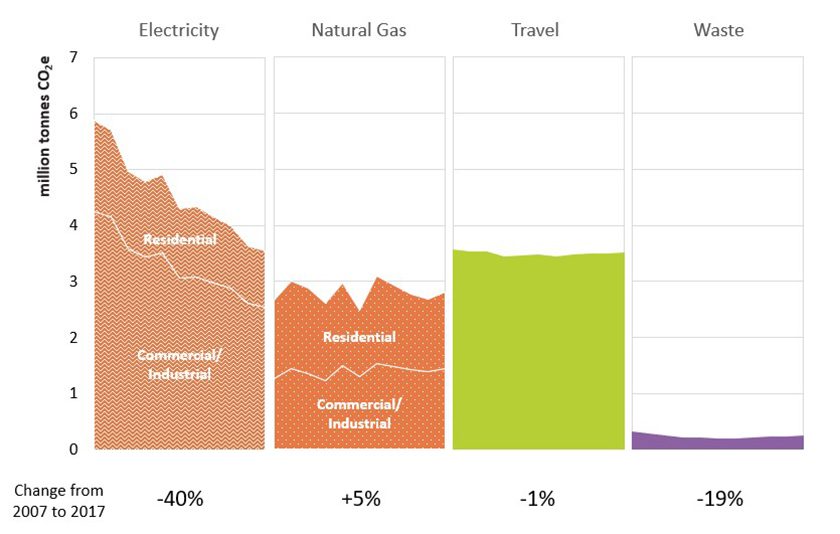
Looking at the change from 2007 to 2017, the electric sector decreased by 40% while natural gas and travel emissions remained relatively constant. We found the reduction in electricity emissions is due to a combination of reducing electricity use by 10% and using electricity that is 33% cleaner.
What should our next steps be?
When RII was first established, many participating cities were focused on setting goals and understanding their existing conditions. In recent years, leading cities have begun planning for short- and long-term action through the development of community-wide Climate Action Plans, such as those LHB worked on for the cities of St. Louis Park, Northfield, and Eden Prairie.
During this same period, climate science has made it increasingly obvious that the next ten years are critical in determining our ability to avoid irreversible climate impacts. Cities must now take action – whether they have a long-term plan in place or not. To this end, LHB has teamed with Great Plains Institute to offer Climate Action Work Plans (CAWP), a streamlined planning process that focuses on identifying actionable, near-term priorities with a measurable impact. Our team worked with Red Wing on the first CAWP, which was adopted in August 2020.
Moving towards resilience
Though slow, we are seeing real progress in our GHG emission reductions. When we find ways to address these issues in our buildings and systems, we improve our resiliency towards future events in an increasingly unstable world. In order to achieve our goals of mitigation and resilience, we must implement our strategies intentionally and with a mindset open to transformative action.